Impermeable walls#
Impermeable walls may be modeled with strings of line-doublets using the
ImpermeableWallString element. The ImpermeableWallString element has an option called
order. The no-flow condition is applied at order+1 control points along the segments.
Between the control points, the condition is met approximately. The modeler needs to
verify whether the chosen lengths of segments and orders results in an accurate
solution.
In the current implementation, order cannot be larger than 8. Impermeable walls can be placed in multiple layers by entering a list of layers using the keyword argument layers = [].
Consider an aquifer with a uniform flow from West to East. The aquifer is divided in
four layers with equal hydraulic conductivity; the model is created with the Model3D
command. A square building pit is surrounded by impermeable walls that extend halfway
into the aquifer: they are placed in the top two model layers. In the center of the
building pit, a well is screened in the top aquifer.
import numpy as np

import timflow.steady as tfs
ml = tfs.Model3D(kaq=1, z=[40, 30, 20, 10, 0], kzoverkh=1)
uf = tfs.Uflow(ml, slope=0.01, angle=0)
rf = tfs.Constant(ml, xr=200, yr=0, hr=50)
xp = [-100, 100, 100, -100, -100]
yp = [-100, -100, 100, 100, -100]
ld = tfs.ImpermeableWallString(
    ml, xy=list(zip(xp, yp, strict=False)), layers=[0, 1], order=3
)
w = tfs.Well(ml, xw=0, yw=0, Qw=400, rw=0.1, layers=0)
ml.solve()
Number of elements, Number of equations: 4 , 33
.
.
.
.

solution complete
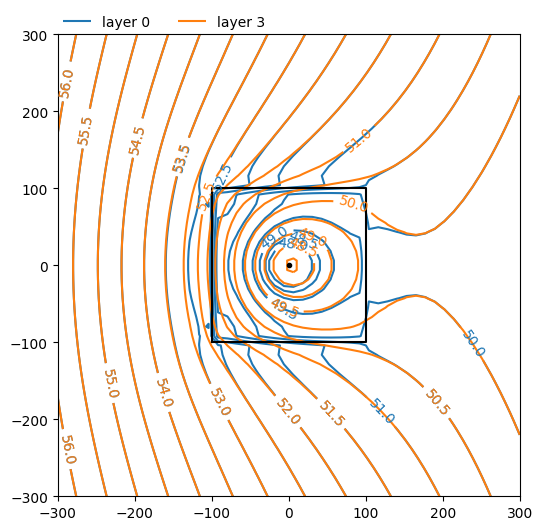
ml.plots.contour(
    win=[-300, 300, -300, 300],
    ngr=50,
    labels=1,
    decimals=1,
    layers=[0, 3],
    levels=np.arange(48, 58, 0.5),
    figsize=(6, 6),
);
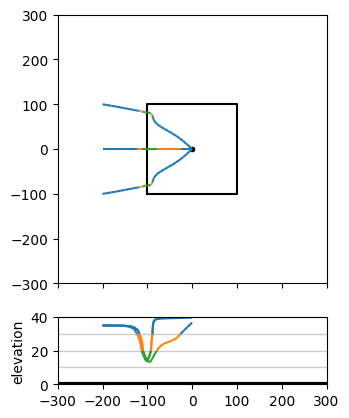
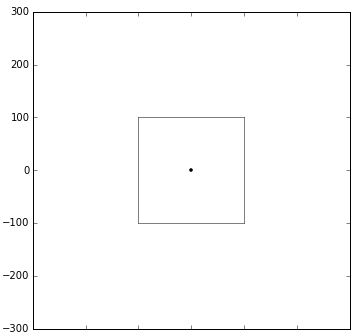
axes = ml.plots.topview_and_xsection(win=[-300, 300, -300, 300])
ml.plots.tracelines(
    xstart=-200 * np.ones(5),
    ystart=np.arange(-200, 201, 100),
    zstart=35 * np.ones(5),
    hstepmax=10,
    tmax=20 * 365.25,
    orientation="both",
    ax=axes,
);
.
.
.
.
.
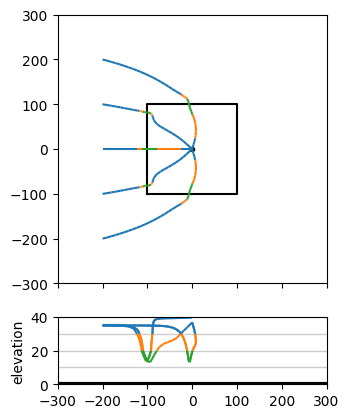
axes = ml.plots.topview_and_xsection(win=[-300, 300, -300, 300])
ml.plots.tracelines(
    xstart=-200 * np.ones(3),
    ystart=np.arange(-100, 101, 100),
    zstart=35 * np.ones(3),
    hstepmax=10,
    tmax=20 * 365.25,
    orientation="both",
    ax=axes,
);
.
.
.