Visualizing models#
import matplotlib.pyplot as plt

import timflow.transient as tft
ml = tft.ModelMaq(
    kaq=[1, 20, 2],
    z=[25, 20, 18, 10, 8, 0],
    c=[500, 1000],
    Saq=[0.1, 1e-4, 1e-4],
    Sll=[0, 0],
    phreatictop=True,
)
ls = tft.RiverString(ml, xy=[(-25, -30), (-15, 10), (10, 20)], tsandh="fixed", layers=0)
w = tft.Well(ml, xw=0, yw=0, rw=0.2, tsandQ=[(0, 1000)], layers=1)

ml.initialize()
ml.solve(silent=True)
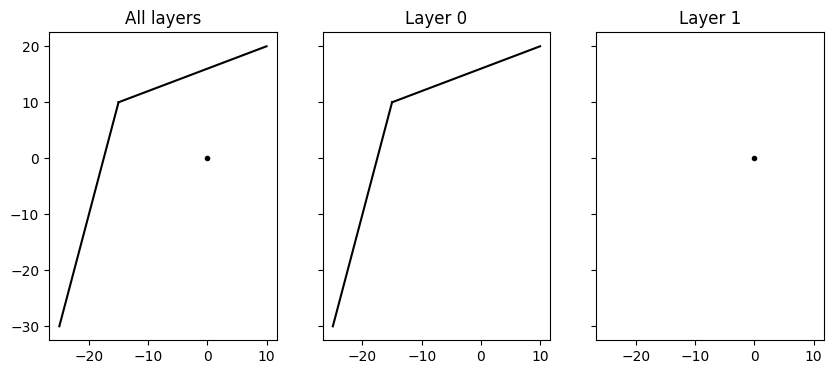
Top-view of model#
Plot a top-view of the model and the locations of the elements.
fig, axes = plt.subplots(1, 3, figsize=(10, 4), sharex=True, sharey=True)

ml.plots.topview(ax=axes[0])
axes[0].set_title("All layers")
ml.plots.topview(ax=axes[1], layers=0)
axes[1].set_title("Layer 0")
ml.plots.topview(ax=axes[2], layers=1)
axes[2].set_title("Layer 1");

# OR
# ml.plot()
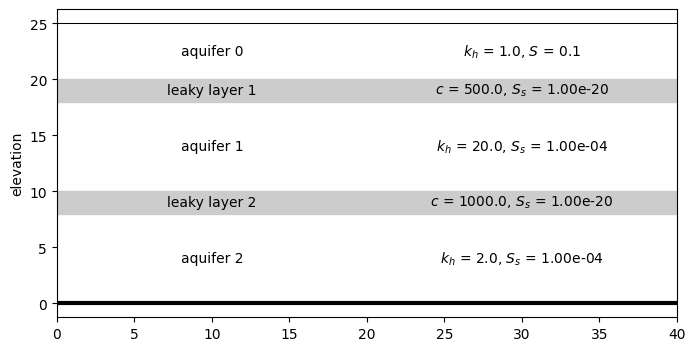
Cross-section of model#
Plot a cross-section of the model along a line. Optionally add labels and parameter values.
Note: Currently no elements are plotted in the cross-section.
ax = ml.plots.xsection(xy=[(-30, 0), (10, 0)], params=True)
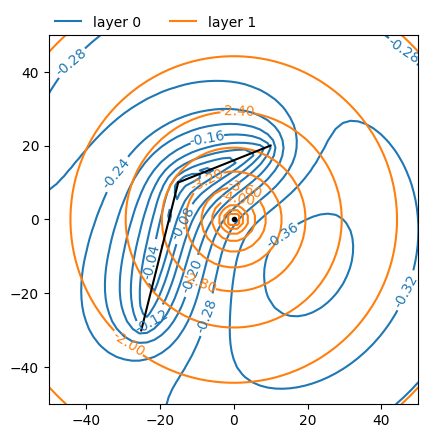
Head contours#
Plot head contours at time \(t\) in a given window in specified layers.
ax = ml.plots.contour(
    win=[-50, 50, -50, 50],
    ngr=50,
    levels=10,
    t=10,
    decimals=2,
    layers=[0, 1],
)
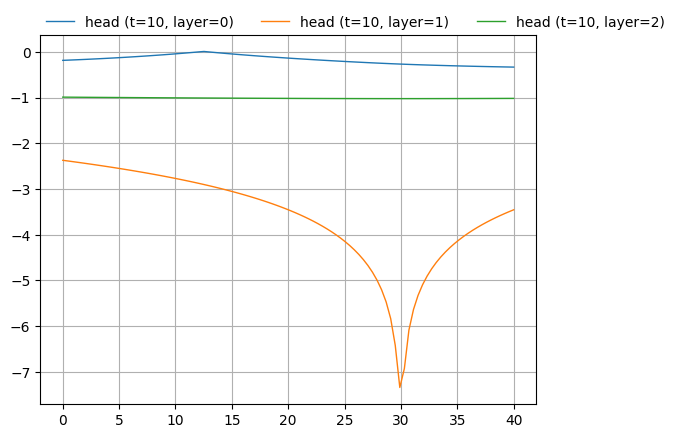
Head along line#
Plot the heads along a given line at time \(t\) in specified layers.
ax = ml.plots.head_along_line(-30, 10, 0, 0, t=10, layers=[0, 1, 2])