1D given Linesink1D#
Test for implementation of given elements.
import matplotlib.pyplot as plt
import numpy as np

import timflow.transient as tft
z = [0.0, -5.0, -6.0, -15.0]
Saq = [0.2, 1e-4]
c = [10.0]
k = [5.0, 10.0]
delh = 1.0
res = 10.0
mlconf = tft.ModelMaq(
    kaq=k,
    z=z,
    Saq=Saq,
    c=c,
    topboundary="conf",
    phreatictop=True,
    tmin=1e-2,
    tmax=1e2,
)

inhom_left = tft.XsectionMaq(
    mlconf,
    x1=-np.inf,
    x2=10.0,
    kaq=k,
    z=z,
    Saq=Saq,
    c=c,
    topboundary="conf",
    phreatictop=True,
)
inhom_right = tft.XsectionMaq(
    mlconf,
    x1=10.0,
    x2=np.inf,
    kaq=k,
    z=z,
    Saq=Saq,
    c=c,
    topboundary="conf",
    phreatictop=True,
)

qls = tft.DischargeLineSink1D(
    mlconf,
    xls=0.0,
    tsandq=[(0, 1.0), (10.0, 2.0)],
    layers=[0, 1],
)
mlconf.solve()
self.neq  4
solution complete
x = np.array([10.0])
y = np.zeros_like(x)
t = np.concatenate([np.logspace(-2, 1, 51), np.logspace(1, 1.5, 51)])
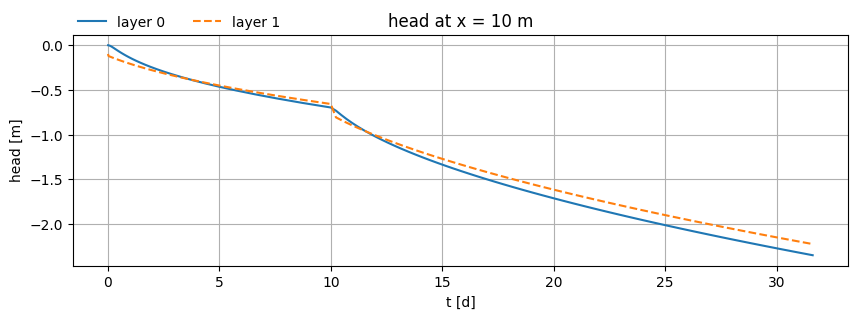
fig, ax = plt.subplots(1, 1, figsize=(10, 3))
h = mlconf.headalongline(x, y, t)
ax.plot(t, h[0].squeeze(), label="layer 0")
ax.plot(t, h[1].squeeze(), label="layer 1", ls="dashed")
ax.legend(loc=(0, 1), frameon=False, ncol=3)
ax.set_title(f"head at x = {x[0]:.0f} m")
ax.set_xlabel("t [d]")
ax.set_ylabel("head [m]")
ax.grid()
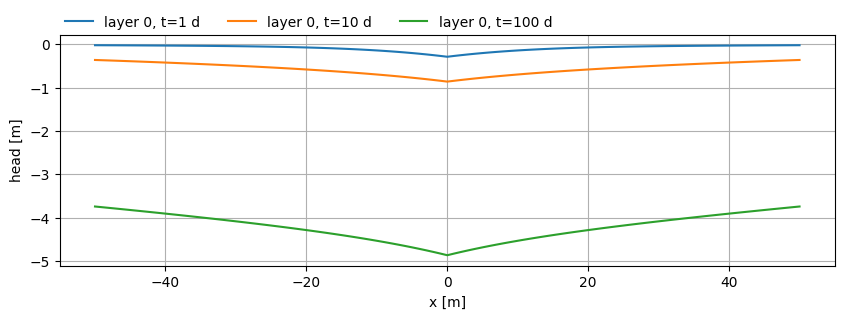
x = np.linspace(-50, 50, 101)
y = np.zeros_like(x)
t = [1, 10, 100]

fig, ax = plt.subplots(1, 1, figsize=(10, 3))

h = mlconf.headalongline(x, y, t)
for i in range(len(t)):
    ax.plot(x, h[0, i].squeeze(), label=f"layer 0, t={t[i]} d")
# ax.plot(t, h[1, i].squeeze(), label="layer 1", ls="dashed")

ax.legend(loc=(0, 1), frameon=False, ncol=3)
ax.set_xlabel("x [m]")
ax.set_ylabel("head [m]")
ax.grid()
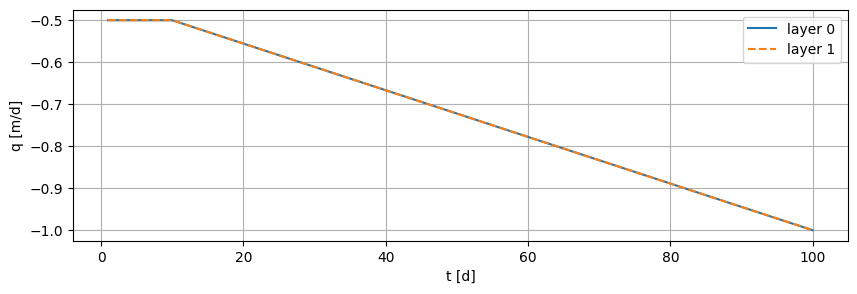
qx, _ = mlconf.disvec(1e-6, 0.0, t)

plt.figure(figsize=(10, 3))
plt.plot(t, qx[0], label="layer 0")
plt.plot(t, qx[1], ls="dashed", label="layer 1")
plt.grid(True)
plt.ylabel("q [m/d]")
plt.xlabel("t [d]")
plt.legend();